In the previous blog of Brevo we saw how Big data analytics is key in transforming today’s businesses, defined the new and different challenges which are brought in to the organization while adopting and implementing big data analytics. We also analyzed these challenges and had a brief overview of the approach, Design and Technology perspective, Brevo follows to overcome these challenges. In this Blog (Brevo: Part II personalized and simplified user experience) we would like to take you to journey of how Brevo was designed by converting paint point to customer value and market opportunity.
One thing the designers of Brevo always looked at was end user experience. It was important to address the needs of each persona and enhance user satisfaction by improving the usability, accessibility, and pleasure provided in the interaction while analyzing the unearthed information.
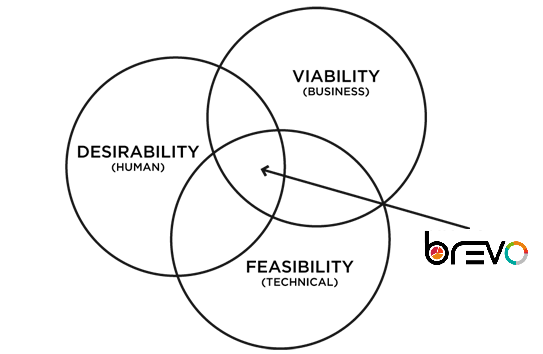
UX first approach was even more important considering the unique challenges (discussed in the previous blog) which Big data analytics bring-in. Any organization would like to spend more effort on decision making than working on these challenges. The UX first approach would help the business users to easily visualize and take an informed decision on the data which is intelligently categorized to them (more on this in the next blog). With Brevo our goal was also to helps the data scientist and IT to pre-process, filter and model the data by providing operational inputs from the businesses through a simplified experience.
Keeping the above goals in mind and in-order to understand the needs of Big data analytics in depth we conducted a Design thinking with a leading Equipment manufacturing industry, we will call them as EMI based in the USA.
//Story
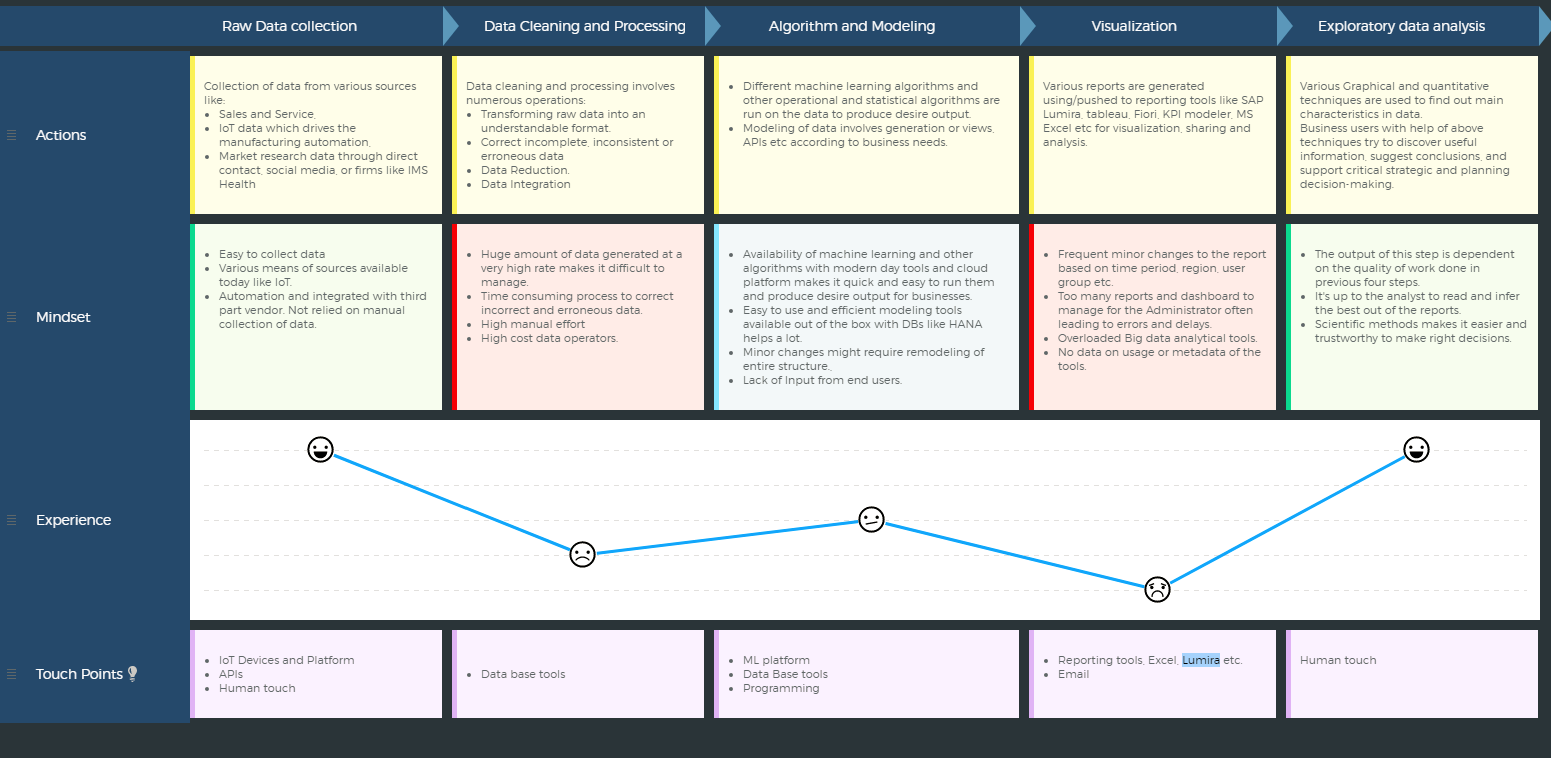
Like any other organization, EMI, is keen to analyze the huge amount of data they are able to gather today through various means like Sales and Service, IoT data which drives the manufacturing automation, market research data through direct contact, social media, or firms like IMS Health. The organization lead by Data Scientist not just wanted to run analytics and unearth information that could be used for future decisions but also have the ability to identify insights for businesses which would assist them in immediate decision making. These quick insights would help business users make better decisions in sales and marketing, production planning, service management etc. The ability to work faster and stay agile would give EMI the competitive edge over others.
The challenges faced were not only restricted to the information or the pattern discovery process but also visibility. The IT department was constantly requested for data in form of KPIs, dashboards, reports etc. from different business users of various departments. This overloaded data operations and report generations in the IT often lead to delays or error-prone reports.
//Personas
//Journey map
//Point of view
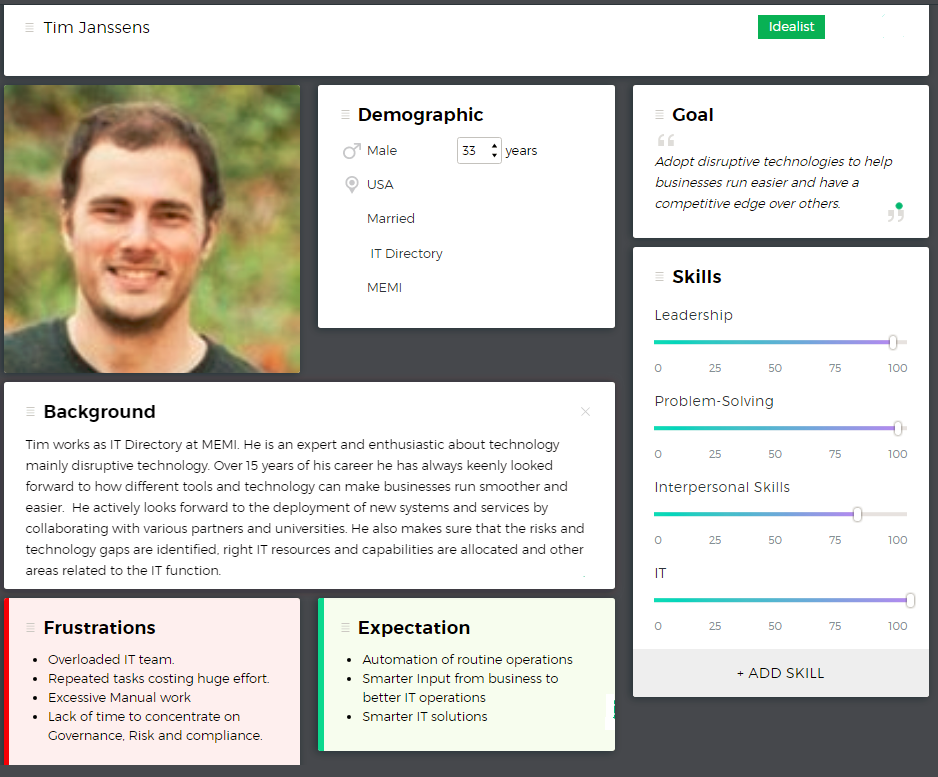
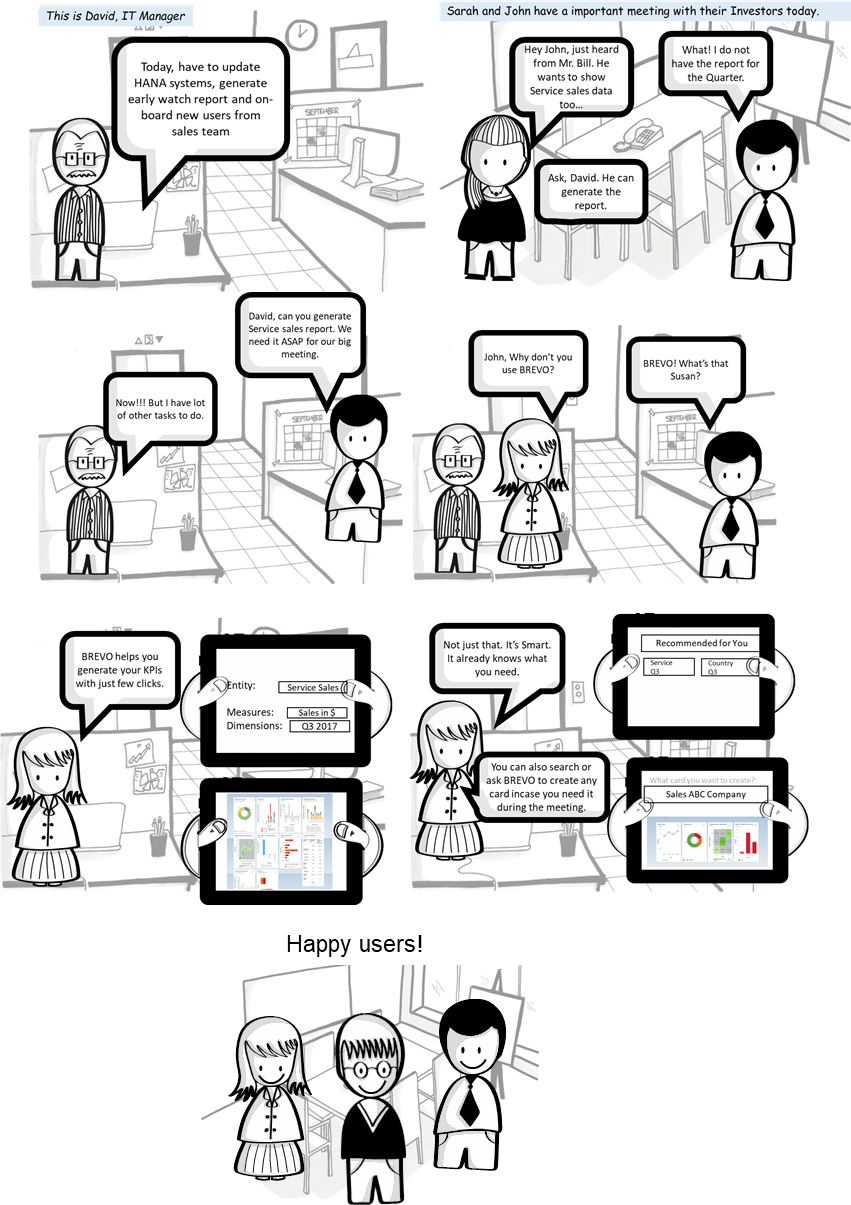
Tim, who is the director of IT, needs a way to provide KPIs and reports to the sales team and also other departments without the need of being dependent on his team every time. He would not only like to automate the generation of reports but would also like to give more power to the sales guys on what kind of information and how would they like to see the information. Tim would also like to get some inputs from the users so they have more intelligence when preparing data.
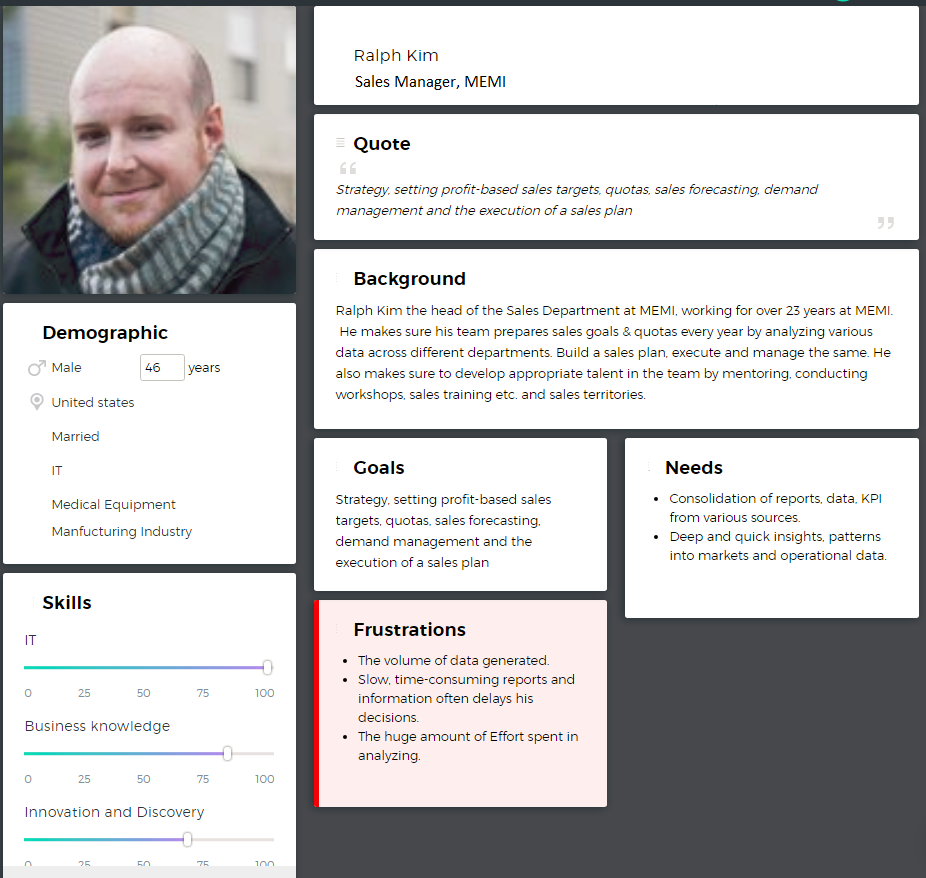
The sales manager needs to have critical information unearth faster and accurately, he believes this is possible in giving his team ability to visualize data according to their roles and position. The users in his team would be happier if this can be done without being burdened by overloaded tools. Giving more power to end users would also reduce the workload of the IT.
Also, it was clearly seen that a cluster of users across organization where interested in similar kind of reports and KPI with few to minor changes in filters and dimension parameters. This resulted in multiple generation or revisit of same reports repeatedly. Hence, giving the end users more power made more sense as they could make these changes without troubling the IT which would reduce the workload of the IT dept. Therefore, allowing IT in putting more effort on pre-processing and modeling of right data.
//Prototype
The point of view from different users at EMI gave designers of Brevo excellent insights and ideas what the industry is actually looking for. The businesses or the analyst need a customizable, simple yet smart and efficient tool to visualize the data. They were interested for a self-service analytical tool but more importantly not overwhelming and hard to use. They preferred data pre-processing and modeling to be carried out of by the data scientist and experts.
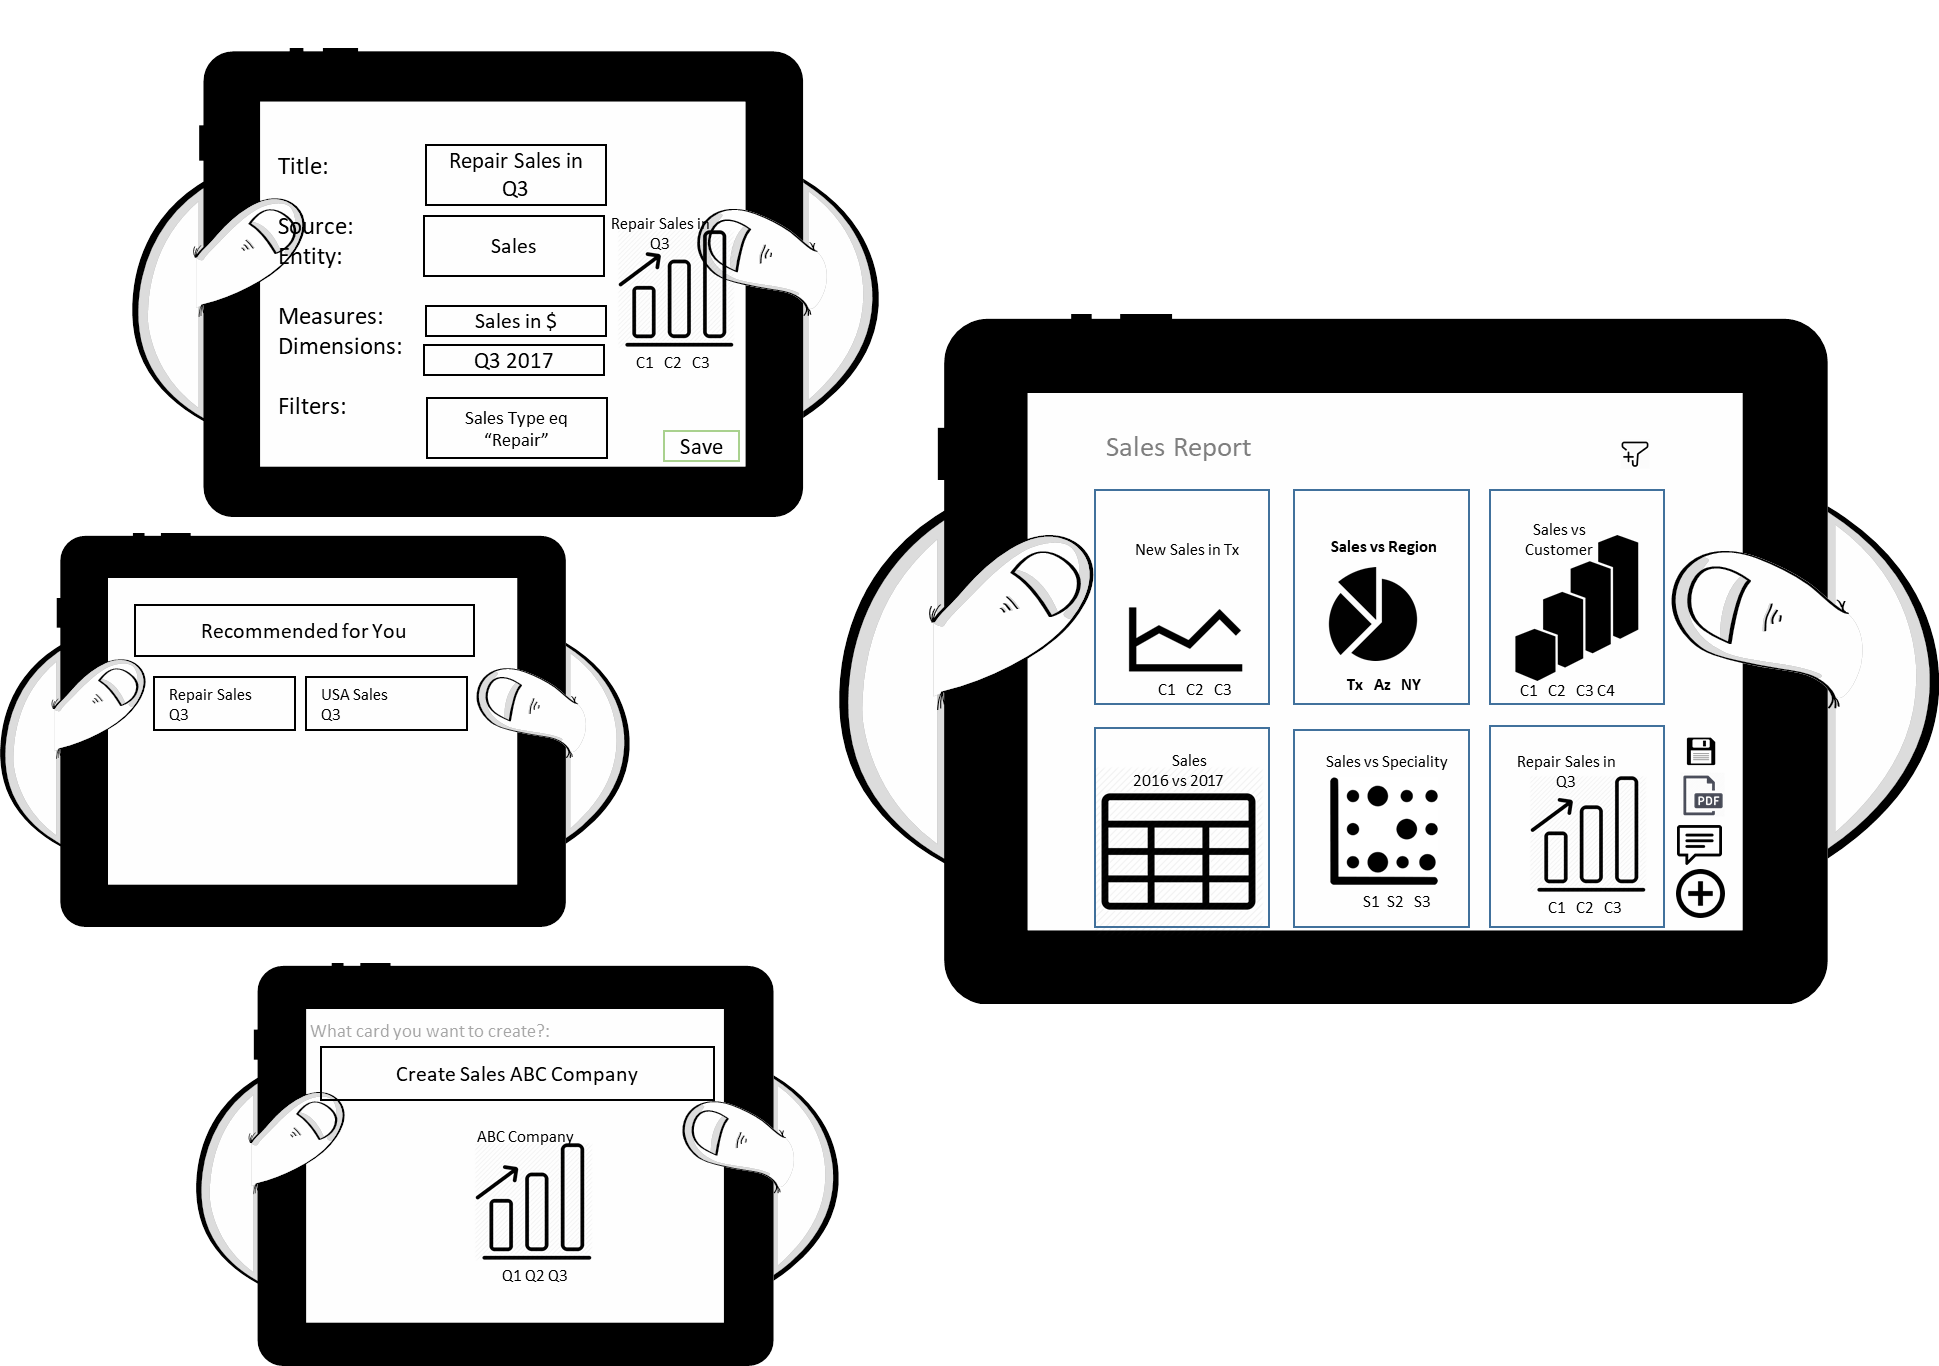
Keeping these views in mind, we designed Brevo, card-based dashboard where the user can create their cards within 3-4 very simple steps. Not just that we also designed a Mini-Bot where the User can chat to the system and have the card created for them. With this User need not fill boring forms. Bunch of Features like Export as PDF, Filters across KPIs, Instant Preview, Comments on various levels of data, Categorization of Cards, Sharing with other users were added into Brevo according to the design principals of Fiori so that the app is Easy and Efficient to use.
//Test
So how did this help overcome Big data analytics challenges? The whole design thinking process helped us clearly differentiate the needs and role of each persona and the journey they undergo.
- By doing so the business users no longer had to worry about the 3vs of Big data whereas the IT or Data operators could work on preprocessing and modeling of data without having the burden of the generation of reports.
- Two different groups of Users could work completely in isolation but still support each other strongly. The operations performed by the businesses where an excellent input to the IT or data operator to filter out the huge amount of data at a very early stage hence, addressing the 3Vs of big data.
In the next blog, we will see in detail how these inputs to Machine learning where next steps in further addressing 3Vs of big data. Along with this, we will also see how Brevo became from a Personalized and Simplified Analytical tool to a Smart Analytical Tool.



Leave A Comment