

Big data analytics scrutinizes huge amount of data to discover hidden patterns, relations, and other valuable insights. Today, it’s possible to analyze data in any organization and get results almost immediately. Whereas a few years ago a business would have gathered information, run analytics and unearthed information that could be used for future decisions, today that business can identify insights for immediate decisions. The ability to work faster – and stay agile – gives organizations a competitive edge they didn’t have before.
// So what is the problem?
But on the other hand, the big data brings in its own challenges. Variety, Velocity, and Volume, the three Major challenges defines what big data is. It’s important to understand the 3Vs as defined by the META Group (now Gartner) before we learn the objectives and goals of Big data analytics.
Variety:
Data structure has changed to lose its structure and to add hundreds of formats. The video, audio, spatial data, IoT Sensor data, pure text, Images, PDFs etc., one no longer has to control over the input data format. As new applications and technologies, like AI, ML, Block Chain etc., can be easily incorporated in businesses, new data sources and formats come to life. Structure or centralized data sources can no longer be imposed like in the past in order to keep control over the analysis.
Velocity:
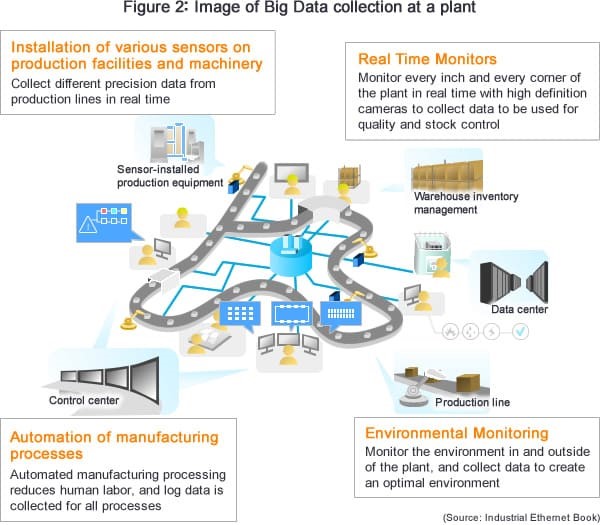
Let’s consider a manufacturing industry to understand what and how velocity is a challenge in Big data. The Manufacturing industry automates its production lines by collecting various information through logs, various sensors and environmental information inside and outside of the plant. This type of data is not expected to expand as violently as other fields, for example, the field of general consumer marketing, but in high velocity (frequency of data occurrence). Managers/Technicians try to control production facilities and machinery by analyzing this data in real time. The high frequency of data occurrence makes it almost impossible to pre-process, discover the pattern and analyze to take appropriate decisions.
Volume:
Volume is the V most associated with big data. In the olden days, all data was generated internally by employees. Currently, the data is generated by employees, partners, customers, and Machines. For example, Hundreds of millions of smartphones send a variety of information for automobile traffic management or even assist in Incident management at Oil fields. This data did not exist 10 years ago.
// Diagnosing the Problem
The objectives of analysts in Big data analytics is to:
- Faster, better decision making: businesses should be able to analyze information immediately – and make decisions based on what they’ve learned.
- New products and services: With the ability to estimate or determine customer needs and satisfaction through analytics comes the power to give customers what they want.
- Cost reduction: identify more efficient ways of doing business.
But the today’s big data analytics tool provides a single layer of data pre-processing, filtering, modeling, and visualization. Dependency among each other and the 3vs of big data makes it challenging for the users to leverage full capabilities of such tools. Also, it’s a known fact that users tend to revisit or recreate similar KPIs over a period of time. Hence the IT gets overloaded with requests for data operations and report generation. Therefore, every organization spends over 80% of their effort in addressing the challenges and only 20% on working for their objectives.
// how to address these issues?
The first step the tools need to take: Rethink the approach to analytics.
 Design perspective:
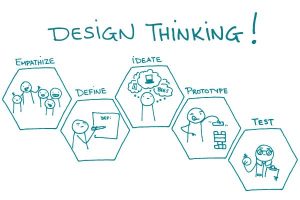
Instead of building overloaded tools and making it complex for businesses to use, it’s important to take a design thinking (https://en.wikipedia.org/wiki/Design_thinking) approach and address the pain points of different personas throughout their journeys. Doing so, the needs of business users, data scientist and IT will be addressed separately. Also, uses the designer’s sensibility and methods to match user’s needs with what is technologically feasible and what a viable business strategy can convert into customer value and market opportunity.
 Technology perspective:
Key technologies like Predictive analytics, Data and Text Mining which are widely used in big data analytics should not be restricted to business data but should also be applied to user data. This will help to understand the user behavioral pattern. Such pattern will be valuable insights for IT in report/KPI generation.
Now that we have come closer to know what are our issues are in big data analytics and how we can address them, wait for the next blog of series which takes you to Journey of design thinking for BREVO.
References:
https://www.sas.com/en_us/insights/analytics/big-data-analytics.html#dmtoday
https://www.datasciencecentral.com/forum/topics/the-3vs-that-define-big-data
https://www.renesas.com/en-us/about/web-magazine/edge/global/13-big-data.html

Leave A Comment